File:Cumulative forgetting curve.jpg

Original file (1,549 × 918 pixels, file size: 598 KB, MIME type: image/jpeg)
Figure: In SuperMemo 18, forgetting curves can be normalized over A-Factors (All AFs) at different repetition categories (All Reps)(as in the picture above). As a result, you can display:
- your cumulative forgetting curve (blue dots)
- its negative exponential approximation used by SuperMemo (red line)
- individual data points from all forgetting curves collected by SuperMemo (yellow circles).
Time (normalized) stands at 100% for maximum U-Factor for each entry of the RF matrix. Decay stands for the decay constant of the forgetting curve. Cases shows the number of repetition cases used in plotting the graph. Repetitions stands for the number of repetitions executed when determining R-Factors. Deviation is a square root of the average of squared differences between the data and the approximated forgetting curve.
File history
Click on a date/time to view the file as it appeared at that time.
| Date/Time | Thumbnail | Dimensions | User | Comment | |
|---|---|---|---|---|---|
| current | 03:07, 25 March 2019 | | 1,549 × 918 (598 KB) | SuperMemoHelp (talk | contribs) | |
| 09:27, 27 July 2013 | 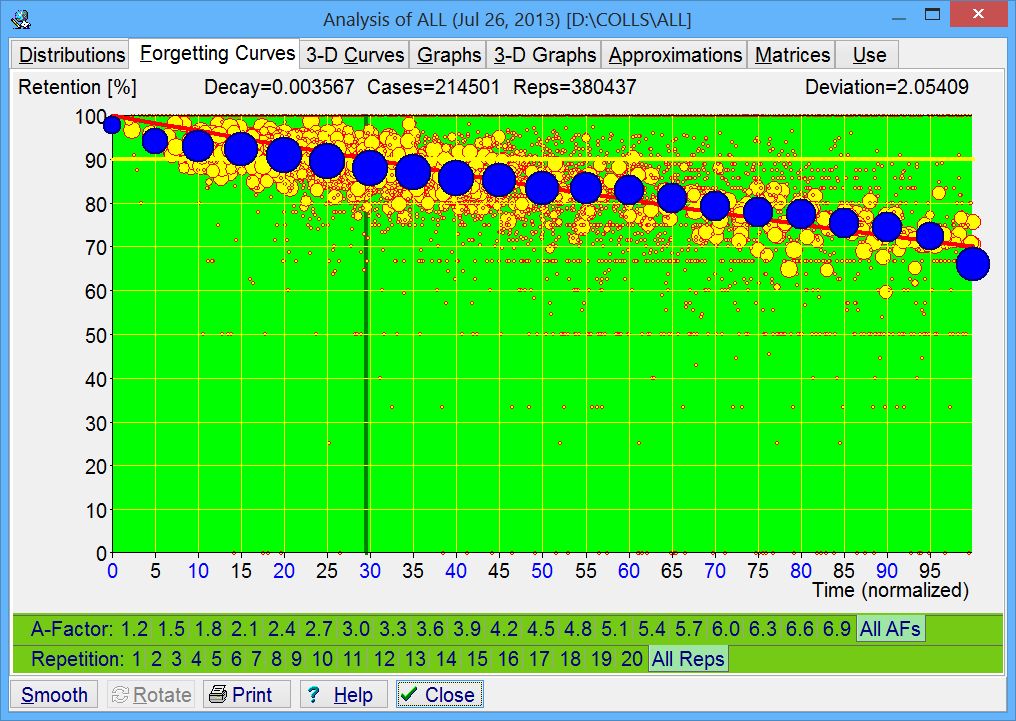 | 1,016 × 721 (193 KB) | SuperMemoHelp (talk | contribs) | * the old one included bugs, incl. the "last point dot" * more reps cases * better deviation | |
| 05:33, 4 August 2011 | 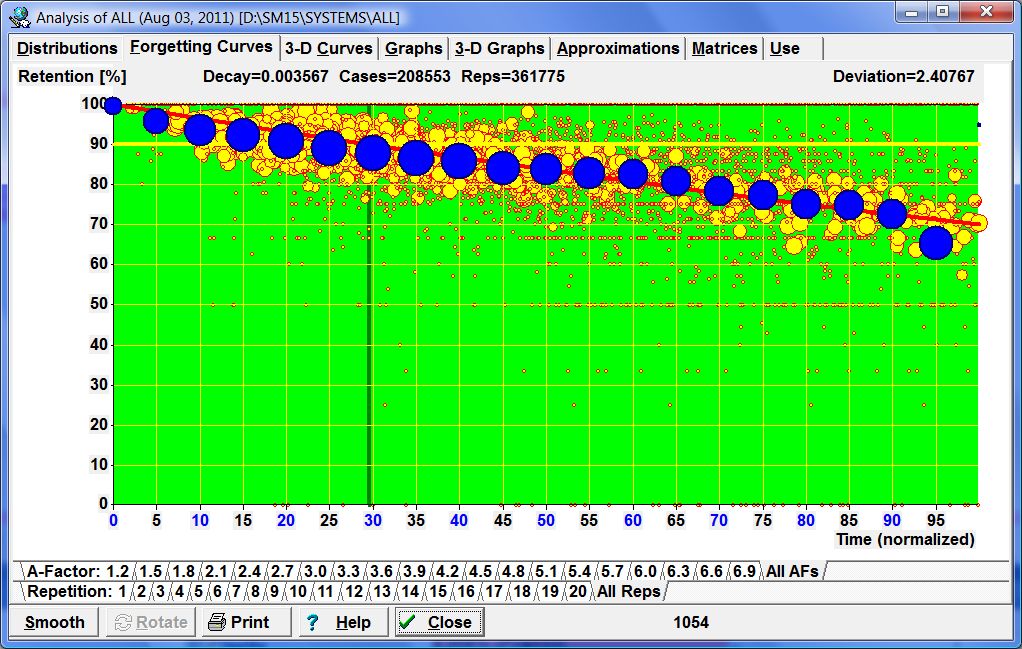 | 1,022 × 649 (183 KB) | SuperMemoHelp (talk | contribs) | In SuperMemo 15, forgetting curves can be normalized over A-Factors at different repetition categories. As a result, you can display (1) your global forgetting curve (blue dots) and (2) its negative exponential approximation used by SuperMemo (red line). |
You cannot overwrite this file.
File usage
The following 2 pages use this file: