File:Cumulative forgetting curve.jpg

Size of this preview: 800 × 474 pixels.
Original file (1,549 × 918 pixels, file size: 598 KB, MIME type: image/jpeg)
In SuperMemo, forgetting curves can be normalized over item difficulty (All AFs) at different memory stabilities (All Reps)(as in the picture above). As a result, you can display:
- your cumulative forgetting curve (blue dots)
- its negative exponential approximation used by SuperMemo (red line)
- individual data points from all forgetting curves collected by SuperMemo (yellow circles).
File history
Click on a date/time to view the file as it appeared at that time.
| Date/Time | Thumbnail | Dimensions | User | Comment | |
|---|---|---|---|---|---|
| current | 03:07, 25 March 2019 | | 1,549 × 918 (598 KB) | SuperMemoHelp (talk | contribs) | |
| 09:27, 27 July 2013 | 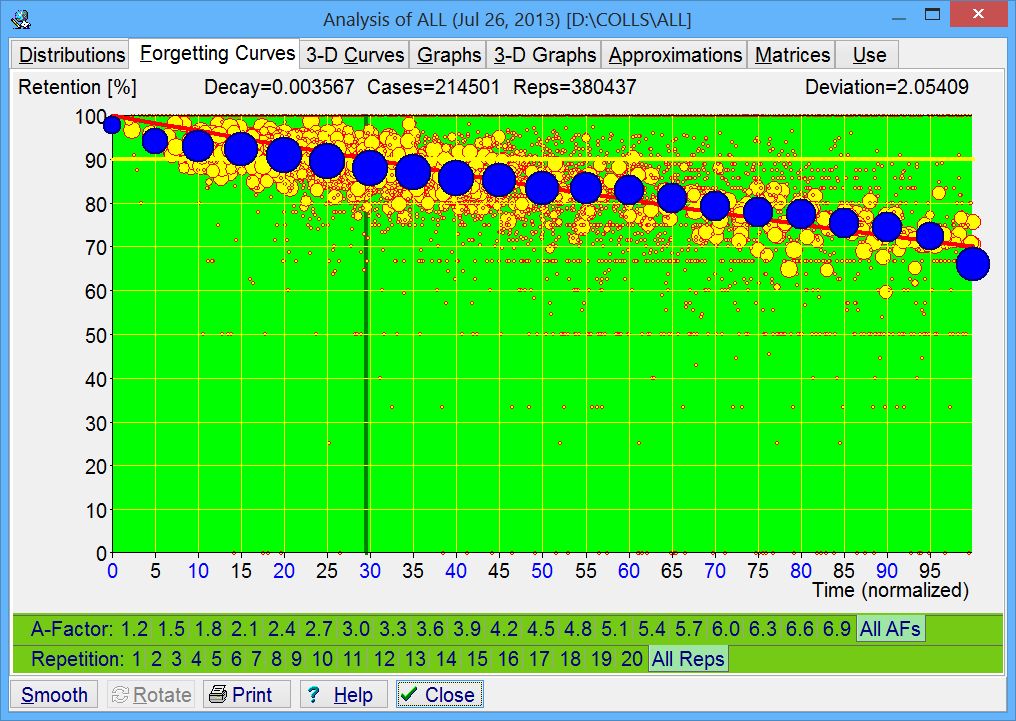 | 1,016 × 721 (193 KB) | SuperMemoHelp (talk | contribs) | * the old one included bugs, incl. the "last point dot" * more reps cases * better deviation | |
| 05:33, 4 August 2011 | 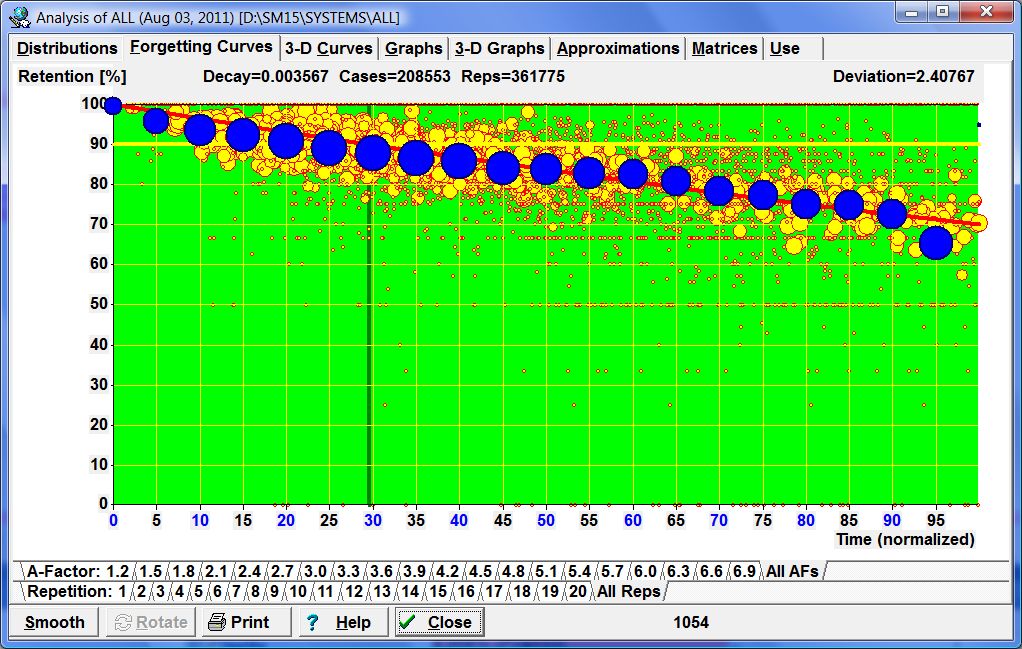 | 1,022 × 649 (183 KB) | SuperMemoHelp (talk | contribs) | In SuperMemo 15, forgetting curves can be normalized over A-Factors at different repetition categories. As a result, you can display (1) your global forgetting curve (blue dots) and (2) its negative exponential approximation used by SuperMemo (red line). |
You cannot overwrite this file.
File usage
The following 2 pages use this file: