File:Sleep and learning timeline with optimization data.jpg
Original file (1,131 × 776 pixels, file size: 233 KB, MIME type: image/jpeg)
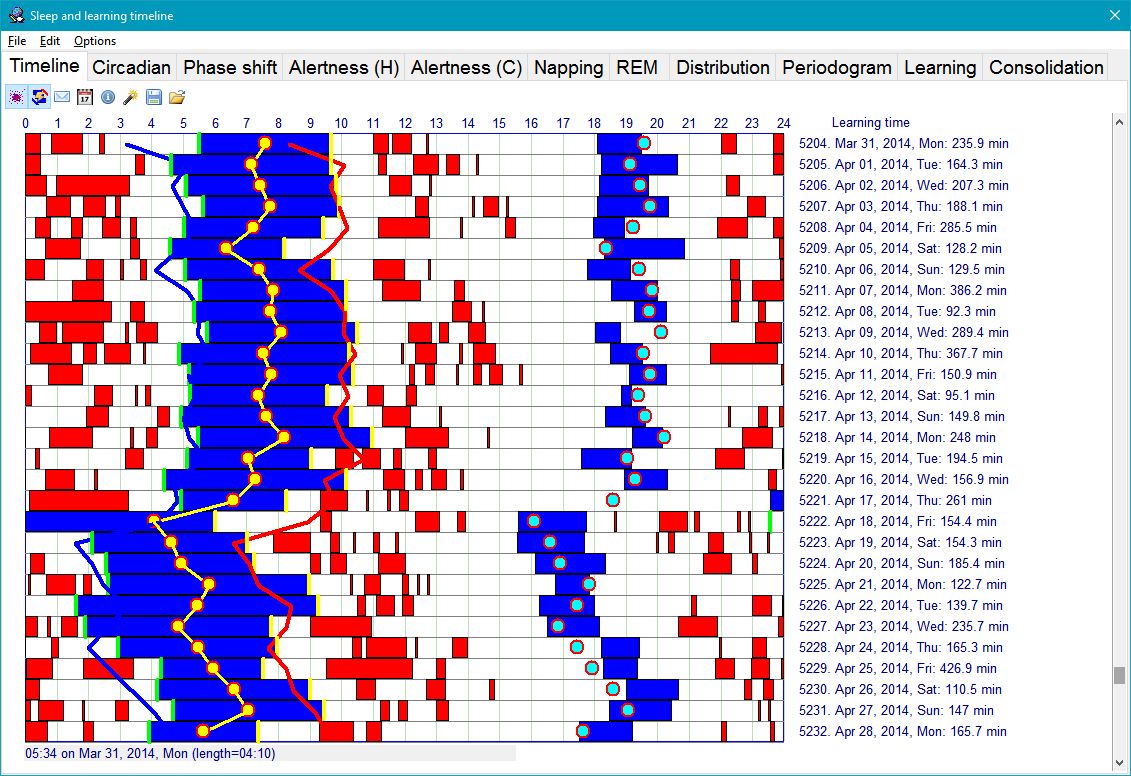
Figure: Sleep and repetitions timeline displaying repetitions blocks of the current collection (in red) and sleep blocks (in blue) with recomputed circadian approximations on the current data. Blue and red continuous lines are predictions of optimum sleep time using the SleepChart model (based on sleep statistics). Yellow continuous line shows the prediction of the maximum of circadian sleepiness (circadian middle-of-the-night peak) using a phase response curve model. Note that, theoretically, the yellow line should roughly fall into the middle between blue and red lines. However, when a disruption of the sleep pattern is severe, those lines might diverge testifying to the fact that it is very hard to build models that fully match the chaotic behavior of the sleep control system subjected to a major perturbation. Aqua dots point to the predicted daytime dip in alertness (i.e. the time when a nap might be most productive).
File history
Click on a date/time to view the file as it appeared at that time.
| Date/Time | Thumbnail | Dimensions | User | Comment | |
|---|---|---|---|---|---|
| current | 10:14, 3 April 2016 | | 1,131 × 776 (233 KB) | SuperMemoHelp (talk | contribs) | |
| 12:15, 22 October 2013 | 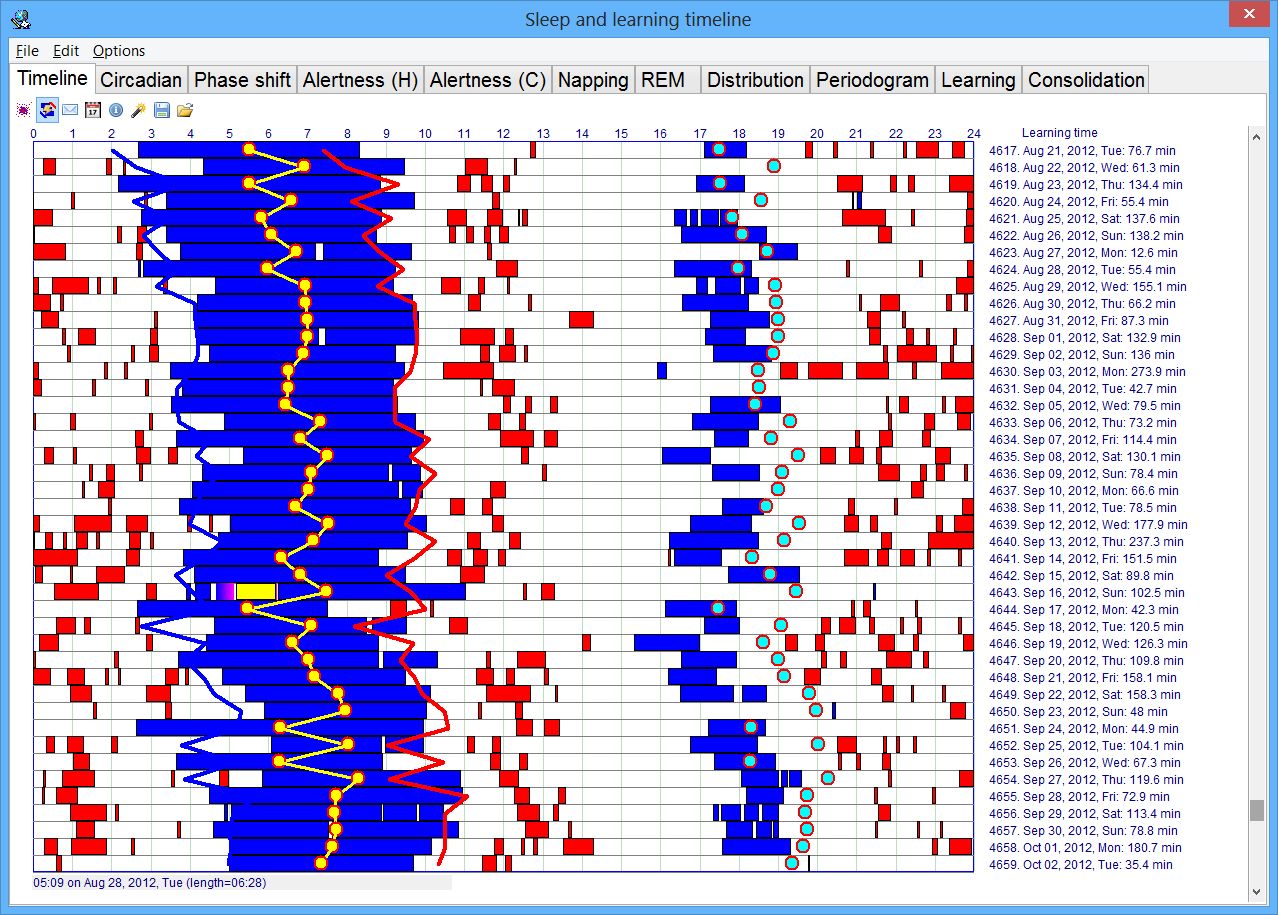 | 1,278 × 915 (323 KB) | SuperMemoHelp (talk | contribs) | ||
| 09:40, 4 May 2009 | 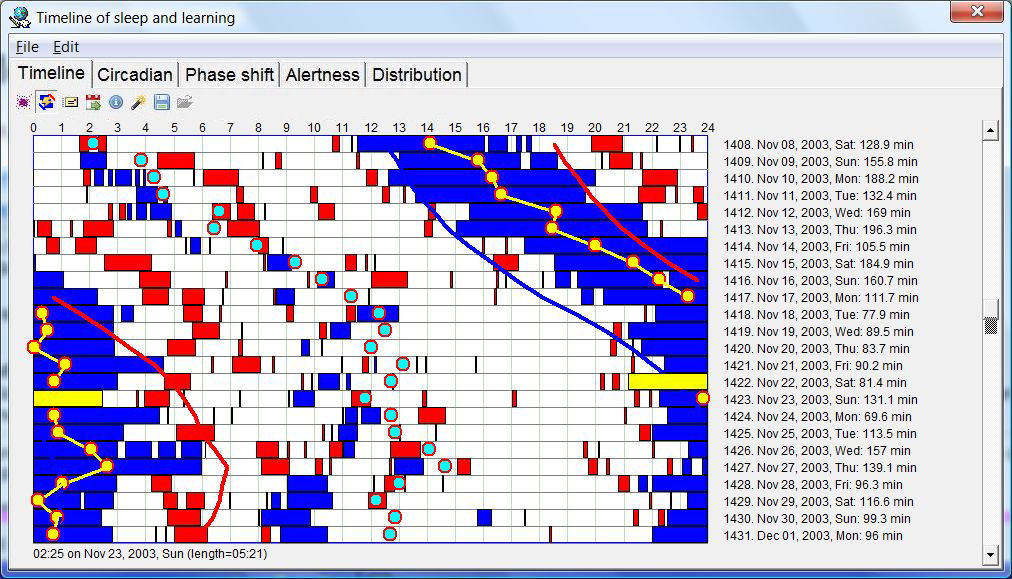 | 1,012 × 579 (169 KB) | WikiSysop (talk | contribs) | Sleep and repetitions timeline displaying repetitions blocks of the current collection (in red) and sleep blocks (in blue) with recomputed circadian approximations on the current data |
You cannot overwrite this file.
File usage
The following 3 pages use this file: