File:Stability increase function.png
Original file (1,920 × 1,200 pixels, file size: 153 KB, MIME type: image/png)
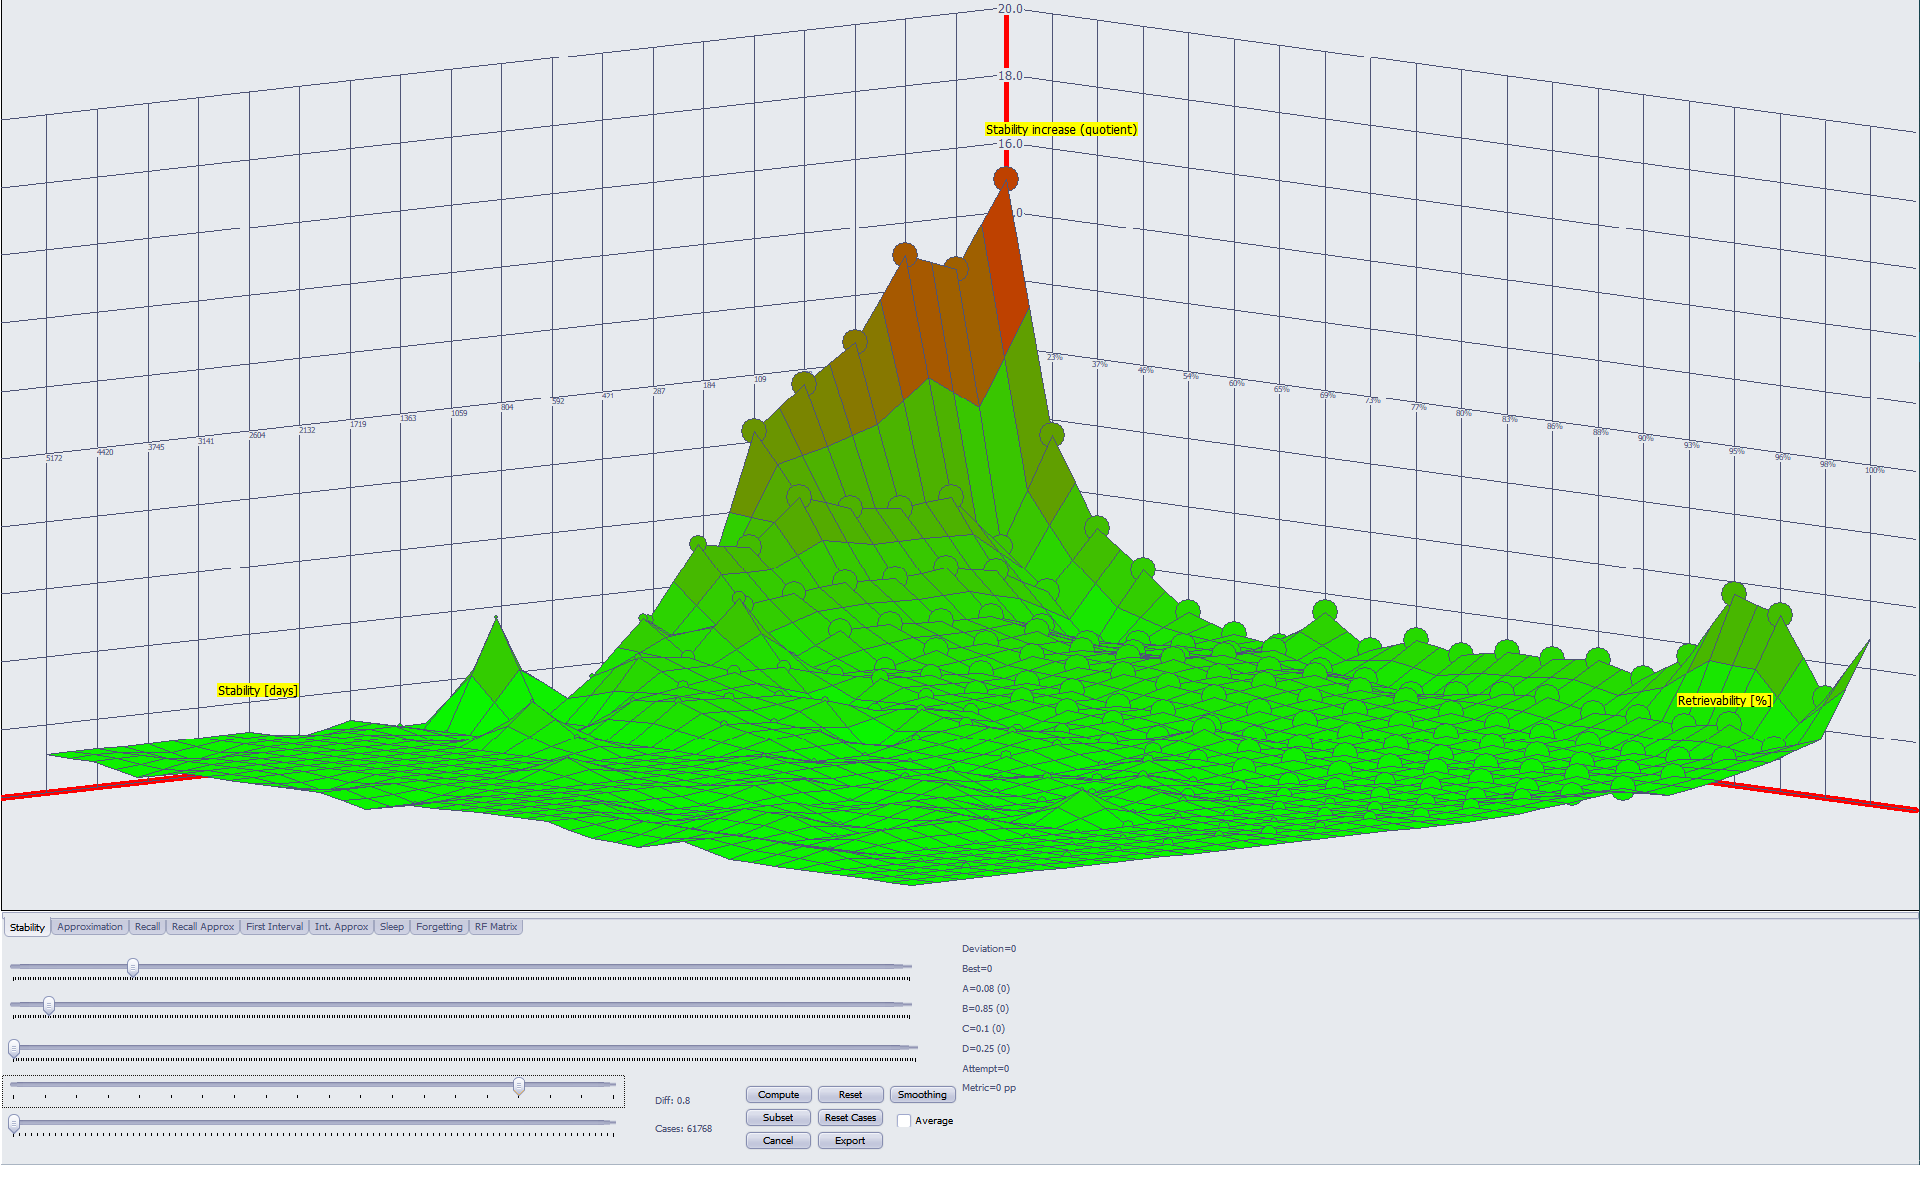
Figure: Stability increase function as computed by Algorithm SM-18. The function takes three arguments: (1) stability at review expressed in days (on the left), (2) retrievability at review (on the right), and (3) memory complexity expressed as item difficulty (slider labelled Diff currently set at 0.8). In the picture, stability increase peaks at around 15 (vertical axis). For some levels of stability and retrievability, the function drops below 1.0 indicating a decrease in stability (e.g. due to premature review evoking the spacing effect in massed presentation). 61,768 repetitions of relatively difficult items were needed to produce this graph (at Diff=0.8). The longest intervals reach around 14 years (stability quantile 5172)
File history
Click on a date/time to view the file as it appeared at that time.
| Date/Time | Thumbnail | Dimensions | User | Comment | |
|---|---|---|---|---|---|
| current | 13:04, 16 March 2019 | | 1,920 × 1,200 (153 KB) | SuperMemoHelp (talk | contribs) | {{Fig|Stability increase function as computed by Algorithm SM-17. The function takes three arguments: (1) stability at review expressed in days (on the left), (2) retrievability at review (on the right), and (3) memory complexity expre |
You cannot overwrite this file.
File usage
The following 2 pages use this file: