File:Repetitions graph.png: Difference between revisions
Time flow of knowledge in the learning process |
No edit summary |
||
| Line 1: | Line 1: | ||
<blockquote>'''''Figure''': The horizontal axis corresponds with the repetition number and the vertical axis represents [[Glossary:Interval|intervals]] (logarithmic scale). Despite a popular belief, the semi-log scale does not produce a linear graph here. Clearly the increase in the length of intervals slows down with successive repetitions. Moreover, the graph corresponding with zero [[Glossary:Lapse|lapses]] (<span style="padding: 3px; color: white; background-color: red;">red</span> curve), results from the superposition of [[Glossary:Item|items]] with lower and faster increase in [[Glossary:Interval|intervals]] (determined by [[Glossary:Difficulty|difficulty]]). The bell-shaped curve is determined by all contributing [[Glossary:Item|items]] (below repetition number 10) and then only by difficult items or items with low [[Glossary:Forgetting_index|forgetting index]] for which the increase in the length of [[Glossary:Interval|intervals]] is significantly slower (above repetition 10). To see the above graph in your own [[Glossary:Collection|collection]], use '''[[Browser menu#Tools|Tools]] : Repetitions graph''' on the [[browser menu]]''</blockquote> | |||
Latest revision as of 13:37, 10 March 2016
Figure: The horizontal axis corresponds with the repetition number and the vertical axis represents intervals (logarithmic scale). Despite a popular belief, the semi-log scale does not produce a linear graph here. Clearly the increase in the length of intervals slows down with successive repetitions. Moreover, the graph corresponding with zero lapses (red curve), results from the superposition of items with lower and faster increase in intervals (determined by difficulty). The bell-shaped curve is determined by all contributing items (below repetition number 10) and then only by difficult items or items with low forgetting index for which the increase in the length of intervals is significantly slower (above repetition 10). To see the above graph in your own collection, use Tools : Repetitions graph on the browser menu
File history
Click on a date/time to view the file as it appeared at that time.
| Date/Time | Thumbnail | Dimensions | User | Comment | |
|---|---|---|---|---|---|
| current | 03:36, 6 November 2013 | 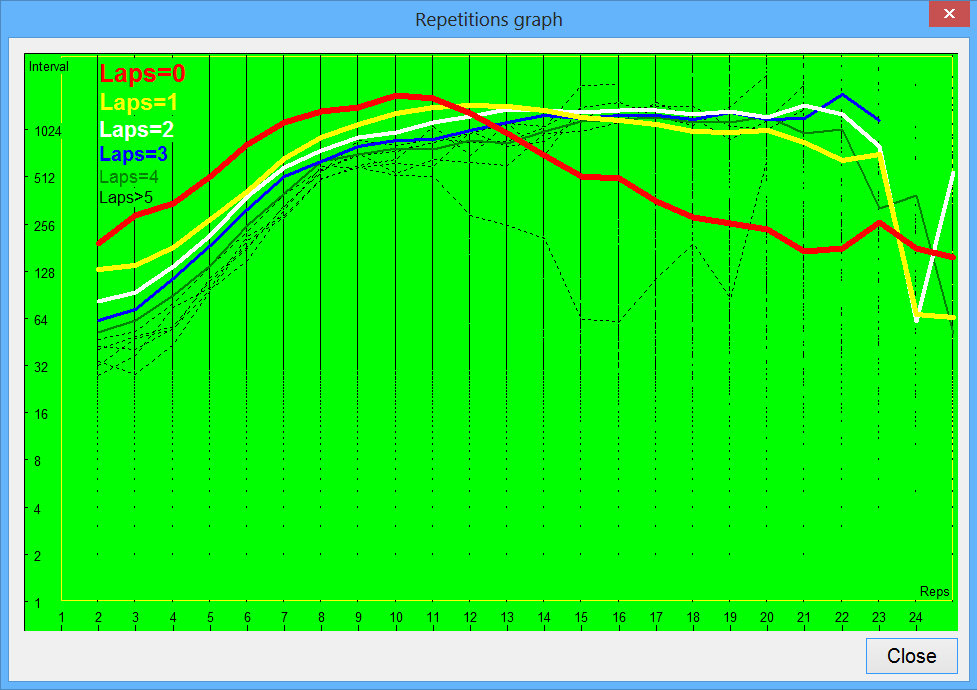 | 977 × 690 (37 KB) | SuperMemoHelp (talk | contribs) | Time flow of knowledge in the learning process |
You cannot overwrite this file.
File usage
The following 3 pages use this file: