File:Phase shift.jpg: Difference between revisions
mNo edit summary |
mNo edit summary |
||
| Line 1: | Line 1: | ||
{{Fig|'''Phase shift''' graph displaying the degree of phase-shift ([https://supermemo.guru/wiki/Advanced_Sleep_Phase_Syndrome_(ASPS) ASPS] or [https://supermemo.guru/wiki/Delayed_Sleep_Phase_Syndrome_(DSPS) DSPS]) as well as its dependence on the time of the day. <span style{{=}}"padding: 3px; color: white; background-color: blue;">Blue line</span> shows the bedtime (vertical axis) for days with a given waking hour (horizontal axis). <span style{{=}}"padding: 3px; color: white; background-color: red;">Red line</span> shows the next day's waking hours (which are shifted by 1-2 hours in DSPS). <span style{{=}}"padding: 3px; background-color: fuchsia;">Fuchsia</span> and <span style{{=}}"padding: 3px; background-color: silver;">gray</span> lines indicate the siesta period. Even though the <span style{{=}}"padding: 3px; color: white; background-color: red;">red waking line</span> begins at the origin of the graph, it shows a substantial phase shift at later hours (DSPS). From the presented exemplary graph one can read that for the waking time equal to 7 am (horizontal axis), the expected time to go to bed, as indicated by the <span style{{=}}"padding: 3px; color: white; background-color: blue;">blue line</span>, is 1 am (vertical axis), while optimum siesta time occurs between 15:00 and 16:00. However, if the wake time is 11 am, the bedtime is likely to come only at 5 am the next day.}} | {{Fig|'''Phase shift''' graph displaying the degree of phase-shift ([https://supermemo.guru/wiki/Advanced_Sleep_Phase_Syndrome_(ASPS) ASPS] or [https://supermemo.guru/wiki/Delayed_Sleep_Phase_Syndrome_(DSPS) DSPS]) as well as its dependence on the time of the day and can be used to see the expected bedtime given a specific natural waking time. <span style{{=}}"padding: 3px; color: white; background-color: blue;">Blue line</span> shows the bedtime (vertical axis) for days with a given waking hour (horizontal axis). <span style{{=}}"padding: 3px; color: white; background-color: red;">Red line</span> shows the next day's waking hours (which are shifted by 1-2 hours in DSPS). <span style{{=}}"padding: 3px; background-color: fuchsia;">Fuchsia</span> and <span style{{=}}"padding: 3px; background-color: silver;">gray</span> lines indicate the siesta period. Even though the <span style{{=}}"padding: 3px; color: white; background-color: red;">red waking line</span> begins at the origin of the graph, it shows a substantial phase shift at later hours (DSPS). From the presented exemplary graph one can read that for the waking time equal to 7 am (horizontal axis), the expected time to go to bed, as indicated by the <span style{{=}}"padding: 3px; color: white; background-color: blue;">blue line</span>, is 1 am (vertical axis), while optimum siesta time occurs between 15:00 and 16:00. However, if the wake time is 11 am, the bedtime is likely to come only at 5 am the next day.}} | ||
Latest revision as of 12:52, 23 March 2019
Figure: Phase shift graph displaying the degree of phase-shift (ASPS or DSPS) as well as its dependence on the time of the day and can be used to see the expected bedtime given a specific natural waking time. Blue line shows the bedtime (vertical axis) for days with a given waking hour (horizontal axis). Red line shows the next day's waking hours (which are shifted by 1-2 hours in DSPS). Fuchsia and gray lines indicate the siesta period. Even though the red waking line begins at the origin of the graph, it shows a substantial phase shift at later hours (DSPS). From the presented exemplary graph one can read that for the waking time equal to 7 am (horizontal axis), the expected time to go to bed, as indicated by the blue line, is 1 am (vertical axis), while optimum siesta time occurs between 15:00 and 16:00. However, if the wake time is 11 am, the bedtime is likely to come only at 5 am the next day.
File history
Click on a date/time to view the file as it appeared at that time.
| Date/Time | Thumbnail | Dimensions | User | Comment | |
|---|---|---|---|---|---|
| current | 09:53, 4 May 2009 | 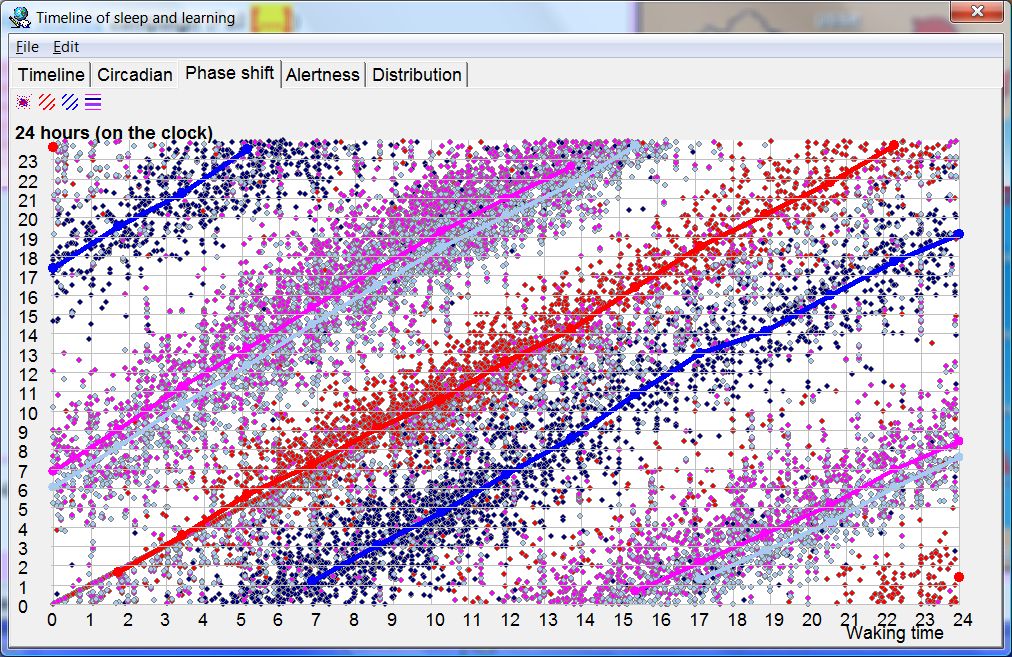 | 1,012 × 657 (291 KB) | WikiSysop (talk | contribs) | Phase shift graph displaying the degree of phase-shift (ASPS or DSPS) as well as its dependence on the time of the day |
You cannot overwrite this file.
File usage
The following page uses this file: