File:Alertness circadian.jpg: Difference between revisions
No edit summary |
mNo edit summary |
||
| Line 1: | Line 1: | ||
{{Fig|'''[[Toolkit menu|Toolkit]] : [[Sleep Chart]] : Alertness (C)''' graph showing the powerfully biphasic nature of the human circadian cycle. The horizontal axis shows the circadian time, i.e. the time that elapses from phase 0, i.e. the predicted "end of the night" time (if '''Model''' is depressed). The prediction comes from the circadian model employed in SleepChart, and is derived from the sleep log data. The <span style{{=}}"padding: 3px; background-color: aqua;">aqua line</span> is the circadian alertness estimate derived from the same sleep log data using the two component model of sleep propensity developed for the purpose of sleep optimization in SuperMemo (inspired by similar work by Alexander A. Borbely and Peter Achermann). The cumulative alertness estimate, represented by the <span style{{=}}"padding: 3px; color: #FFF; background-color: red;">red line</span>, is the resultant of the status of the two components of sleep propensity: the homeostatic component and the circadian component. The <span style{{=}}"padding: 3px; color: white; background-color: blue;">blue dots</span> are recall data taken from the learning process in SuperMemo that correlate well with overall alertness. They clearly demonstrate the biphasic performance during a waking day from 89% in the morning to 80.5% at midday nadir, 85% at evening peak, and 80% before sleep (size of the circles corresponds with repetitions collected; mimimum 54 repetitions needed to paint a circle for this size of the data set). 102,045 repetitions were taken to produce the graph. Depressed '''Use R''' will use R estimates from the DRS model and compute recall gain in comparison with baseline}} | |||
Latest revision as of 05:51, 3 March 2019
Figure: Toolkit : Sleep Chart : Alertness (C) graph showing the powerfully biphasic nature of the human circadian cycle. The horizontal axis shows the circadian time, i.e. the time that elapses from phase 0, i.e. the predicted "end of the night" time (if Model is depressed). The prediction comes from the circadian model employed in SleepChart, and is derived from the sleep log data. The aqua line is the circadian alertness estimate derived from the same sleep log data using the two component model of sleep propensity developed for the purpose of sleep optimization in SuperMemo (inspired by similar work by Alexander A. Borbely and Peter Achermann). The cumulative alertness estimate, represented by the red line, is the resultant of the status of the two components of sleep propensity: the homeostatic component and the circadian component. The blue dots are recall data taken from the learning process in SuperMemo that correlate well with overall alertness. They clearly demonstrate the biphasic performance during a waking day from 89% in the morning to 80.5% at midday nadir, 85% at evening peak, and 80% before sleep (size of the circles corresponds with repetitions collected; mimimum 54 repetitions needed to paint a circle for this size of the data set). 102,045 repetitions were taken to produce the graph. Depressed Use R will use R estimates from the DRS model and compute recall gain in comparison with baseline
File history
Click on a date/time to view the file as it appeared at that time.
| Date/Time | Thumbnail | Dimensions | User | Comment | |
|---|---|---|---|---|---|
| current | 09:59, 3 April 2016 | 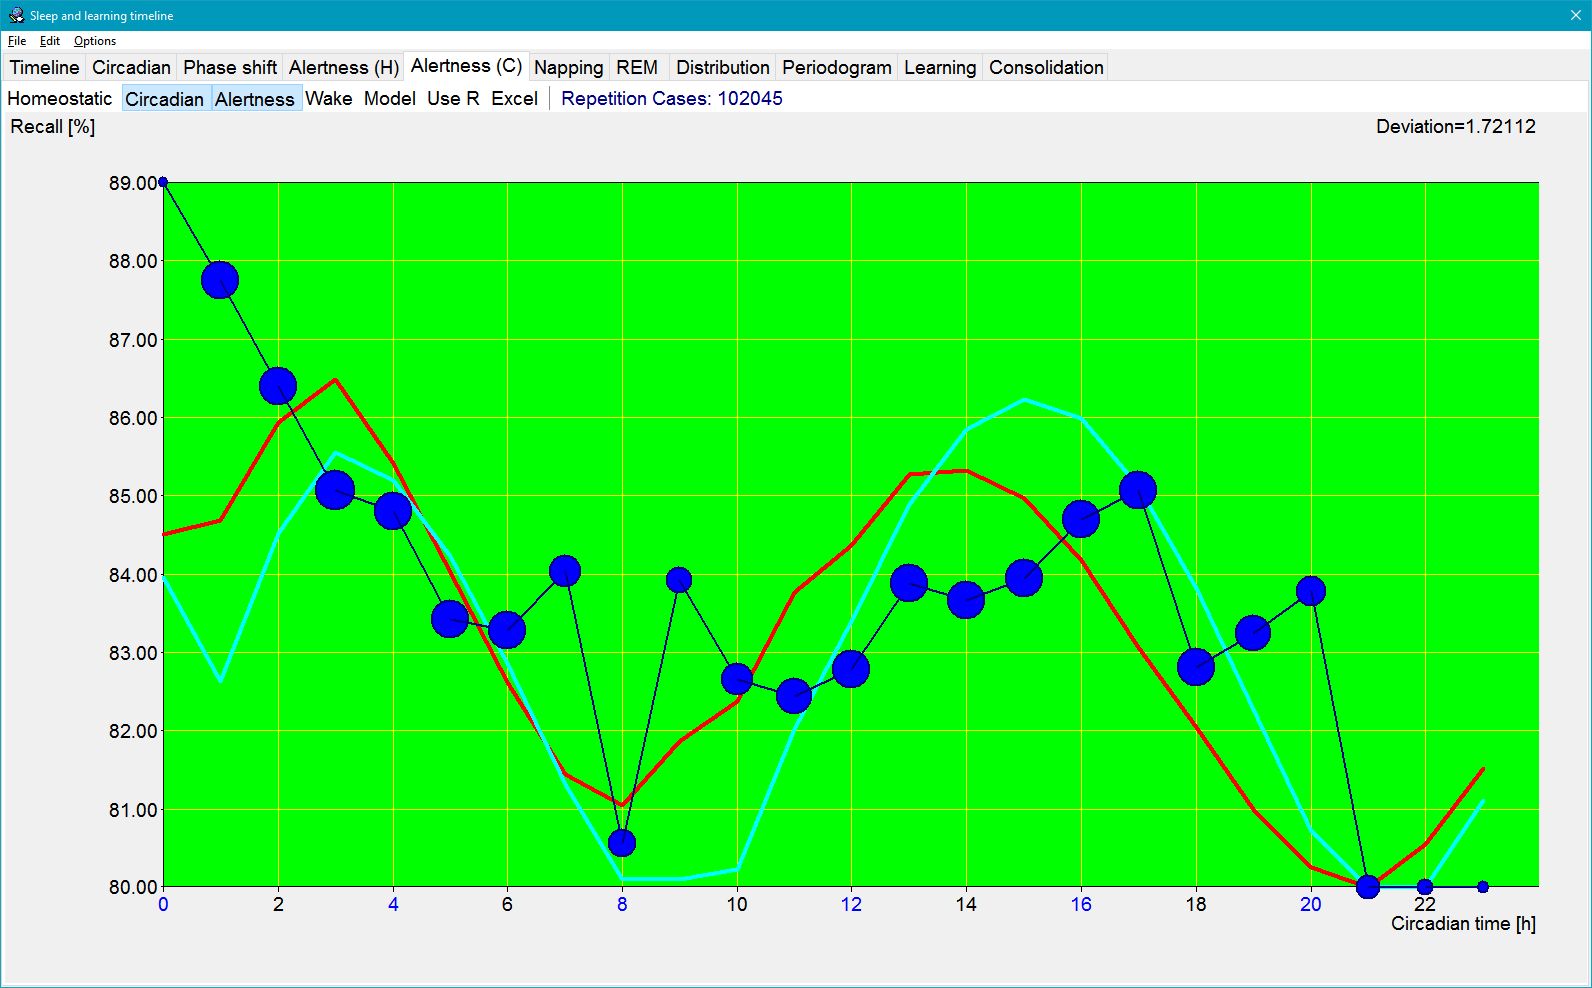 | 1,592 × 988 (181 KB) | SuperMemoHelp (talk | contribs) | |
| 04:38, 12 October 2013 |  | 1,017 × 710 (112 KB) | SuperMemoHelp (talk | contribs) | Alertness (C) from Good Sleep, Good Learning, Good Life | |
| 09:19, 4 July 2011 | 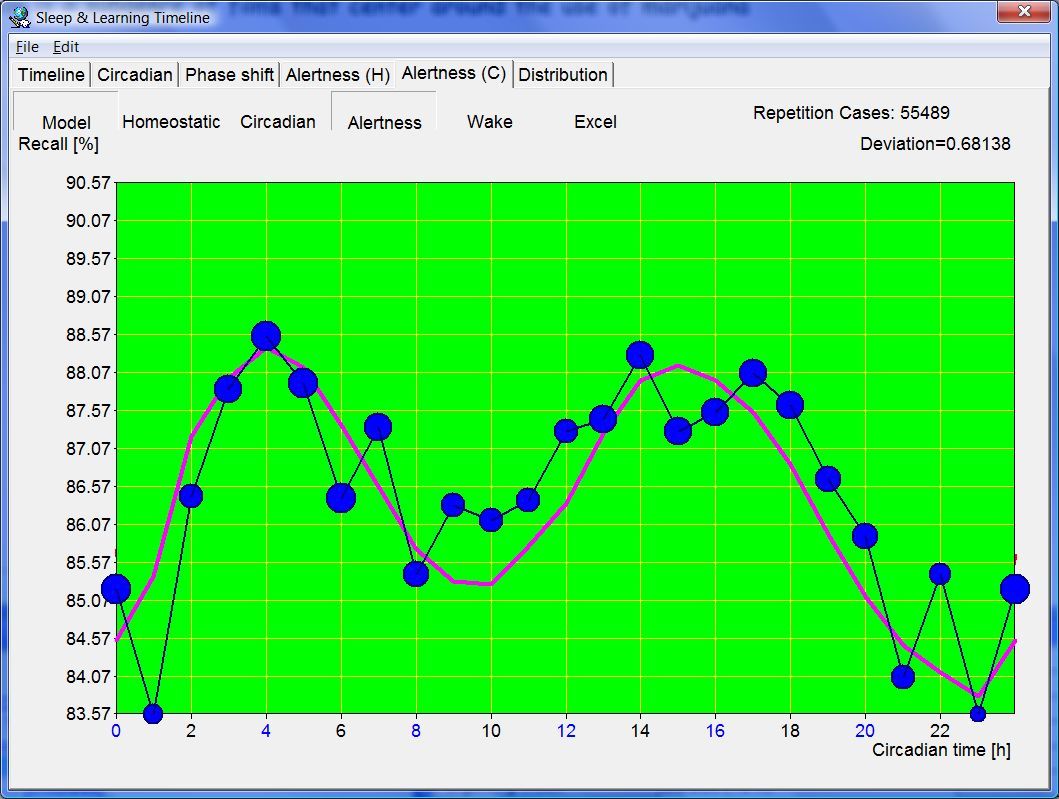 | 1,059 × 799 (132 KB) | SuperMemoHelp (talk | contribs) | Tools : Sleep Chart : Alertness (C) showing the powerfully biphasic nature of the human circadian cycle. |
You cannot overwrite this file.
File usage
The following page uses this file: