File:Alertness homeostatic.jpg: Difference between revisions
Jump to navigation
Jump to search
m moved File:Alertness.jpg to File:Alertness homeostatic.jpg |
uploaded a new version of "File:Alertness homeostatic.jpg" |
(No difference)
| |
Revision as of 11:45, 12 October 2013
Tools : Timeline : Alertness graph makes it possible for you to visually inspect how grades decrease during the waking day. It also shows the impact of circadian factors with grades slightly lower immediately after waking and slightly higher after the mid-day dip in the 9th hour
File history
Click on a date/time to view the file as it appeared at that time.
| Date/Time | Thumbnail | Dimensions | User | Comment | |
|---|---|---|---|---|---|
| current | 04:34, 3 April 2016 | 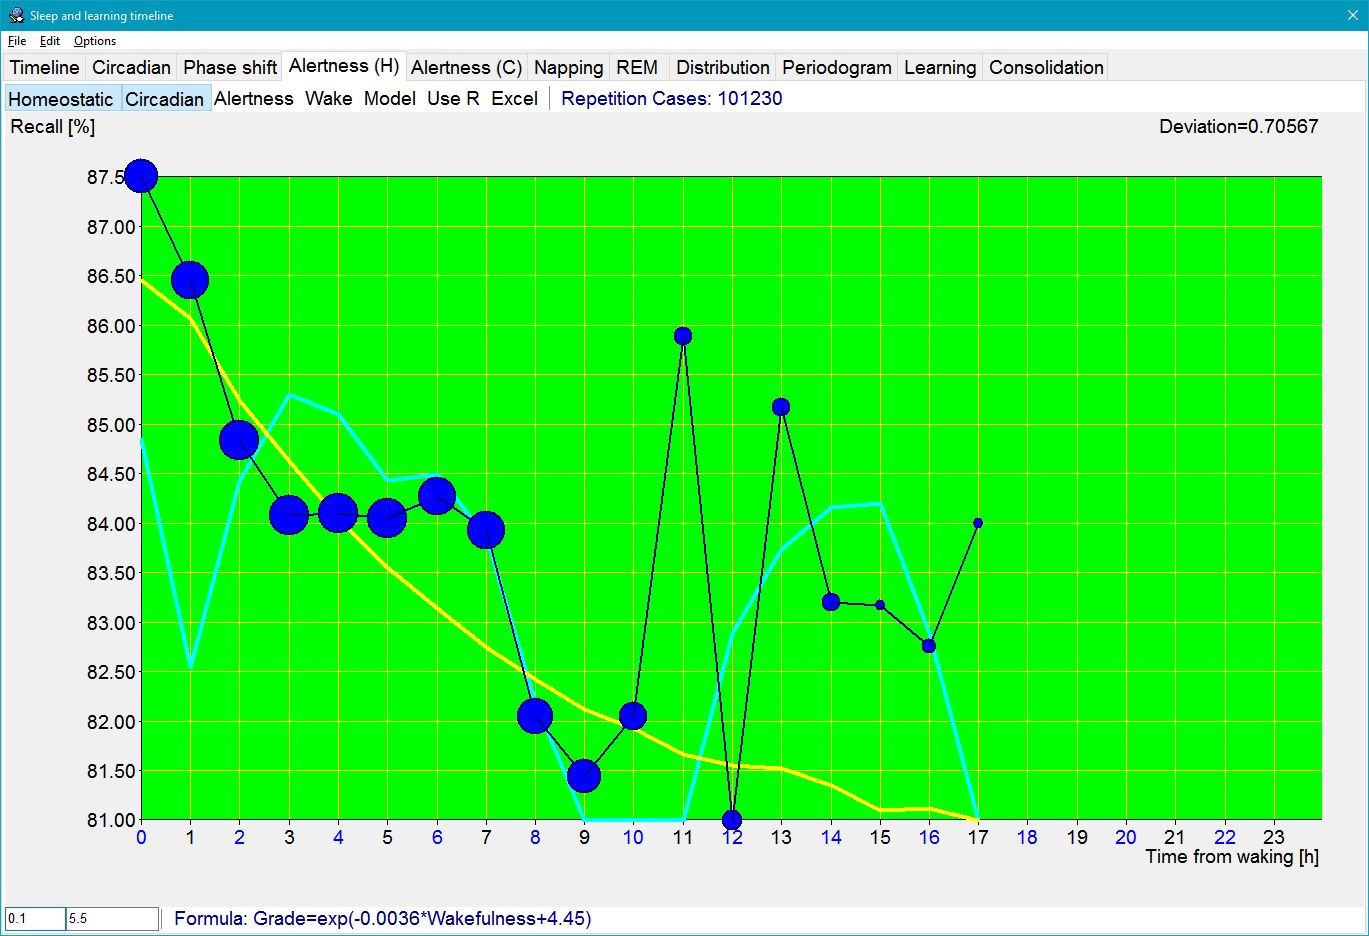 | 1,369 × 936 (192 KB) | SuperMemoHelp (talk | contribs) | |
| 11:45, 12 October 2013 |  | 1,278 × 951 (188 KB) | SuperMemoHelp (talk | contribs) | ||
| 09:21, 24 April 2009 |  | 1,046 × 756 (128 KB) | WikiSysop (talk | contribs) | Tools : Timeline : Alertness graph makes it possible for you to visually inspect how grades decrease during the waking day. It also shows the impact of circadian factors with grades slightly lower immediately after waking and slightly higher after the mid |
You cannot overwrite this file.
File usage
The following 3 pages use this file: