File:Sleep propensity.jpg: Difference between revisions
The predictions of the two-component sleep model about the homeostatic and circadian status of your alertness |
mNo edit summary |
||
| (One intermediate revision by the same user not shown) | |||
| Line 1: | Line 1: | ||
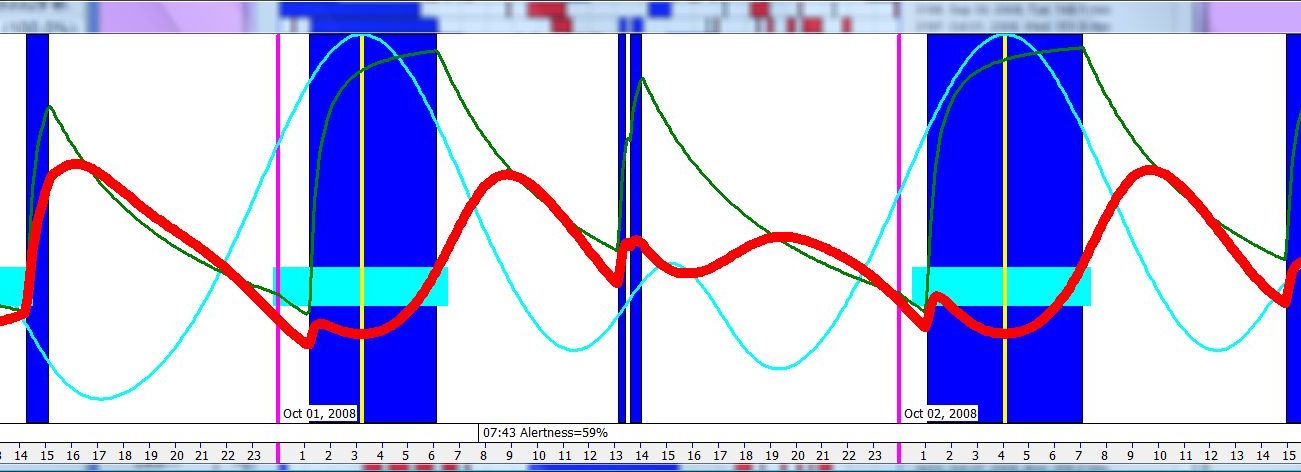
The predictions of the two-component sleep model about the homeostatic and circadian status of your alertness | {{Fig|The predictions of the [https://supermemo.guru/wiki/Two-process_model_of_sleep_regulation two-component sleep model] about the homeostatic and circadian status of your alertness. The horizontal axis represents time. <span style{{=}}"padding: 3px; background-color: blue; color: white;">Blue blocks</span> show the actual sleep episodes. <span style{{=}}"padding: 3px; background-color: aqua;">Aqua line</span> shows the 24h circadian sleep drive with a mid-day siesta hump. <span style{{=}}"padding: 3px; background-color: green;color: white;">Green line</span> is an inverse of the homeostatic sleep drive and can be interpreted as homeostatic alertness, which declines exponentially during wakefulness and is quickly restored by slow-wave sleep (for simplicity, as in Borbely model, the entire sleep block is assumed to have a contribution proportional to its length, as the SleepChart model does not account for sleep stages). <span style{{=}}"padding: 3px; background-color: yellow;">Yellow vertical lines</span> show the prediction of the circadian bathyphase (circadian middle-of-the-night peak). Bathyphase computations are done with the help of a phase response curve model (as opposed to a statistical model used in earlier versions of SleepChart). <span style{{=}}"padding: 3px; background-color: red; color: white;">Red line</span> shows the resultant alertness (peaks are best for learning, valleys are best for sleep). For example, Alertness on Oct 1, 2008 at 7:43 was predicted to be at 59% of the maximum but would keep increasing fast in the first 2 hours of wakefulness (a typical symptom of a night sleep that is terminated too early). The picture shows two peaks in alertness on Oct 1, 2008, at 9 am and at 7 pm. Those periods would likely be best suited for learning on that day.}} | ||
Latest revision as of 12:58, 23 March 2019
Figure: The predictions of the two-component sleep model about the homeostatic and circadian status of your alertness. The horizontal axis represents time. Blue blocks show the actual sleep episodes. Aqua line shows the 24h circadian sleep drive with a mid-day siesta hump. Green line is an inverse of the homeostatic sleep drive and can be interpreted as homeostatic alertness, which declines exponentially during wakefulness and is quickly restored by slow-wave sleep (for simplicity, as in Borbely model, the entire sleep block is assumed to have a contribution proportional to its length, as the SleepChart model does not account for sleep stages). Yellow vertical lines show the prediction of the circadian bathyphase (circadian middle-of-the-night peak). Bathyphase computations are done with the help of a phase response curve model (as opposed to a statistical model used in earlier versions of SleepChart). Red line shows the resultant alertness (peaks are best for learning, valleys are best for sleep). For example, Alertness on Oct 1, 2008 at 7:43 was predicted to be at 59% of the maximum but would keep increasing fast in the first 2 hours of wakefulness (a typical symptom of a night sleep that is terminated too early). The picture shows two peaks in alertness on Oct 1, 2008, at 9 am and at 7 pm. Those periods would likely be best suited for learning on that day.
File history
Click on a date/time to view the file as it appeared at that time.
| Date/Time | Thumbnail | Dimensions | User | Comment | |
|---|---|---|---|---|---|
| current | 10:07, 4 May 2009 | 1,301 × 472 (97 KB) | WikiSysop (talk | contribs) | The predictions of the two-component sleep model about the homeostatic and circadian status of your alertness |
You cannot overwrite this file.
File usage
The following 2 pages use this file: