File:Memory status.jpg: Difference between revisions
No edit summary |
No edit summary |
||
| (3 intermediate revisions by the same user not shown) | |||
| Line 1: | Line 1: | ||
<blockquote> | <blockquote> | ||
'''''Figure:''' Changes over time | '''''Figure:''' Changes in memory status over time for an exemplary [[Glossary:Item|item]]. The horizontal axis represents time spanning the entire [[repetition history]]. The top panel shows [[Glossary:Retrievability|retrievability]] (tenth power, R^10, for easier analysis). Retrievability grid in <span style="padding: 3px; color: #fff; background-color: gray;">gray</span> is labelled by R=99%, R=98%, etc. The middle panel displays [[Glossary:Optimum_interval|optimum intervals]] in <span style="padding: 3px; color: #fff; background-color: navy;">navy</span>. Repetition dates are marked by <span style="padding: 3px; color: #fff; background-color: blue;">blue vertical lines</span> and labelled in <span style="padding: 3px; background-color: aqua;">aqua</span>. The end of the [[Glossary:Optimum_interval|optimum interval]] where [[Glossary:Retrievability|R]] crosses 90% line is marked by <span style="padding: 3px; color: #fff; background-color: red;">red vertical lines</span> (only if [[Glossary:Interval|intervals]] are longer than [[Glossary:Optimum_interval|optimum intervals]]). The bottom panel visualizes [[Glossary:Stability|stability]] (presented as <code>ln(S)/ln(days)</code> for easier analysis). The graph shows that [[Glossary:Retrievability|retrievability]] drops fast (exponentially) after early [[Glossary:Repetition|repetitions]] when [[Glossary:Stability|stability]] is low, however, it only drops from 100% to 94% in long 10 years after the 7th review. All values are derived from an actual [[repetition history]] and the [[Glossary:DSR model|DSR model]].'' | ||
</blockquote> | </blockquote> | ||
Latest revision as of 12:39, 19 June 2016
Figure: Changes in memory status over time for an exemplary item. The horizontal axis represents time spanning the entire repetition history. The top panel shows retrievability (tenth power, R^10, for easier analysis). Retrievability grid in gray is labelled by R=99%, R=98%, etc. The middle panel displays optimum intervals in navy. Repetition dates are marked by blue vertical lines and labelled in aqua. The end of the optimum interval where R crosses 90% line is marked by red vertical lines (only if intervals are longer than optimum intervals). The bottom panel visualizes stability (presented as
ln(S)/ln(days)for easier analysis). The graph shows that retrievability drops fast (exponentially) after early repetitions when stability is low, however, it only drops from 100% to 94% in long 10 years after the 7th review. All values are derived from an actual repetition history and the DSR model.
File history
Click on a date/time to view the file as it appeared at that time.
| Date/Time | Thumbnail | Dimensions | User | Comment | |
|---|---|---|---|---|---|
| current | 06:45, 19 June 2016 | 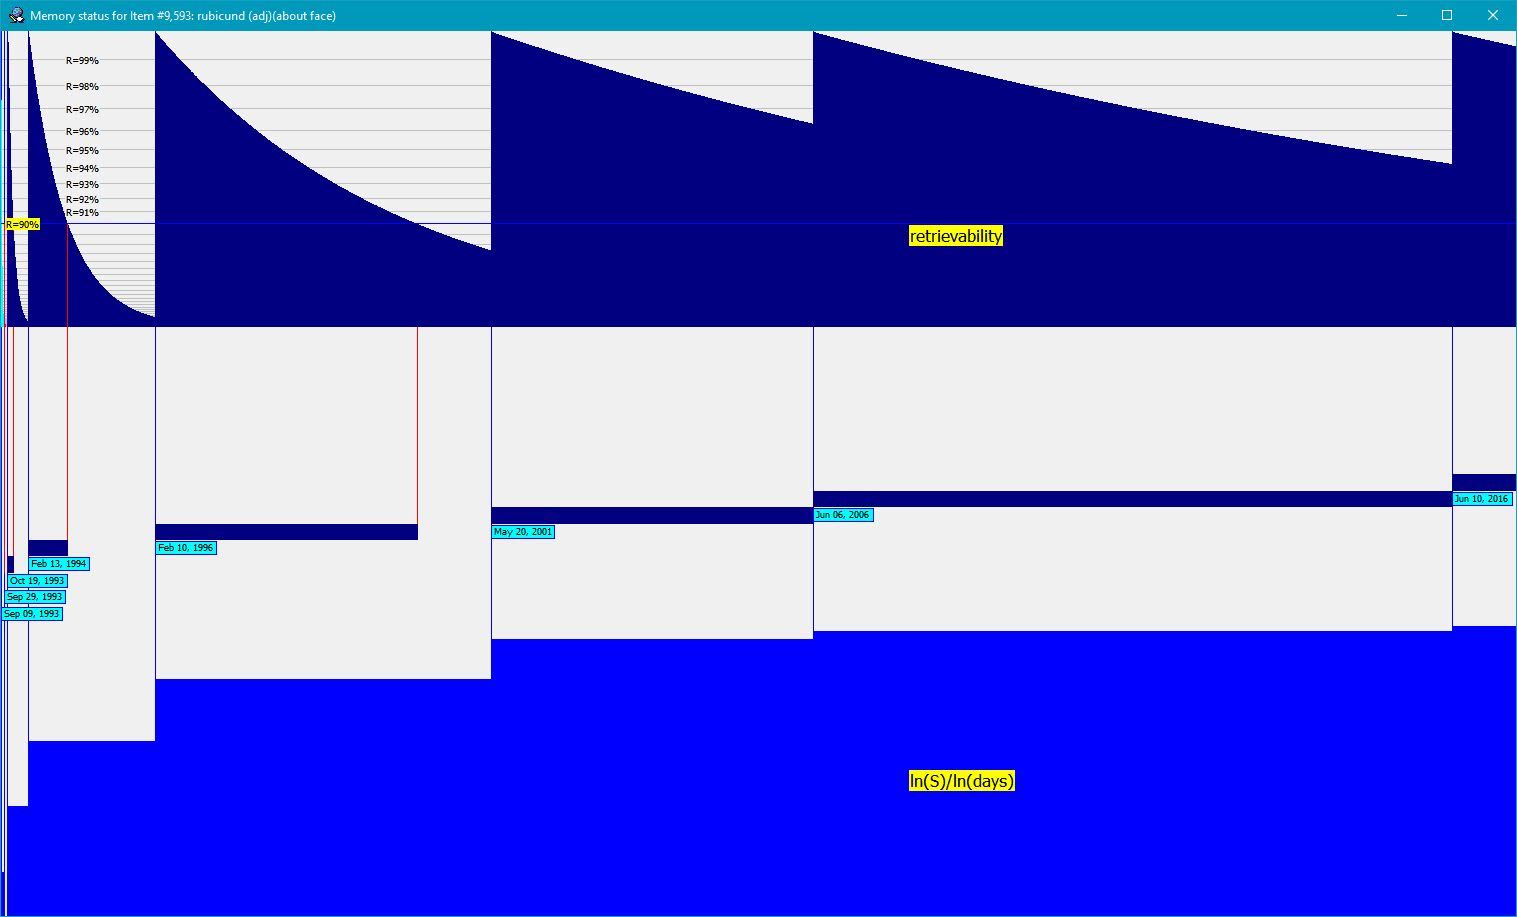 | 1,517 × 917 (69 KB) | SuperMemoHelp (talk | contribs) | Changes to memory status over time |
You cannot overwrite this file.
File usage
The following 4 pages use this file: